Calculators at the ready!
It’s time for another ‘all-time’ feature and this time we look at how many points each Super League team averages per season.
Since 1996 we have seen 22 clubs feature in Super League, with some only spending one season in the division while others have competed for the full 25 years!
While a typical all-time league table usually rewards those that have spent more seasons and played more games in Super League, this ‘points-per-season’ edition gives everyone an equal chance.
It averages out every teams end-of-season points total whether they have played in the competition one year, two years or 25 years – with the table taking into account Super League regular season matches only.
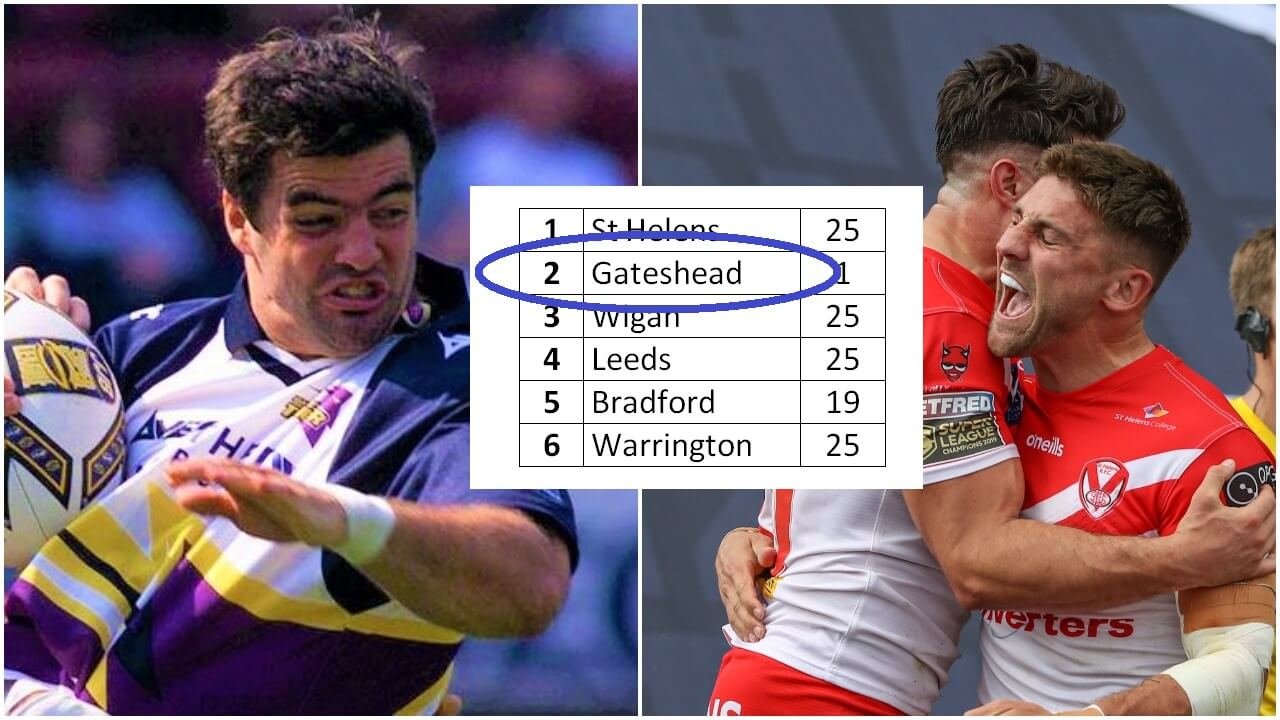
Because of this there are a few surprises, none more so than Gateshead sitting joint top due to winning 19 of their 30 games in their only independent Super League season in 1999.
This gives them 39 points, the exact same amount as eight-time Super League champions St Helens have averaged in the league over the last 25 years.
Wigan and Leeds make up the top four with Bradford, who have been out of Super League since 2014, sitting fifth with an average of 33.3 points-per-season.
Workington are bottom with a lowly five points having won two and drawn one of their 22 matches in the inaugural 1996 season – their only Super League campaign to date.
See the all-time Super League points-per-season league table below, with the columns from left to right as follows: seasons, matches played, won, drawn, lost, average points-per-season.


Rugby League News
Predicting the England squad for the mid-season international

Super League
Super League Player of the Month revealed

Castleford Tigers
Castleford Tigers make Sylvester Namo appeal decision


Super League Disciplinary News
James Child one of three former referees to return to the sport